Ascot Draw Bias: Stall Data for Every Distance
Every serious punter knows the draw matters in horse racing. At Ascot, it matters more than almost anywhere else in Britain. The course’s unique configuration—a straight track for sprints and a sweeping round course for middle distances—creates patterns that show up clearly in the data. Over the past five years, stall 1 at six furlongs has returned a level-stakes profit of +67.33 points. Stall 7 over the same distance? A loss of 75.25 points. That is not noise. That is a systematic edge hiding in plain sight, available to anyone willing to look past the headline tips.
Draw bias at Ascot is not a single phenomenon. It shifts with the going, changes with field size, and behaves differently on the straight course compared to the round. The purpose of this guide is to break down the numbers by distance and surface, explain what causes the patterns, and show you how to apply them when the betting markets open. Some of this will confirm what experienced Ascot-watchers already suspect. Some of it will challenge the received wisdom. All of it comes from verifiable race data rather than intuition or anecdote.
The starting point is understanding Ascot’s physical layout. The straight course runs from the five-furlong start down towards the winning post, with no bends but a pronounced uphill finish. The round course loops through Swinley Bottom before joining the home straight with roughly two and a half furlongs to run. Each configuration creates different pressures on horses drawn high or low, and those pressures intensify when the ground softens or the field expands. What follows is a distance-by-distance examination of where the advantage lies—and where the market consistently gets it wrong.
Why the Draw Matters More at Ascot Than Most Courses
Draw bias exists at most racecourses to some degree, but few tracks produce the consistent patterns you find at Ascot. Three factors combine to make the draw unusually significant here.
The first is the straight course itself. Unlike curved tracks where positioning matters more than starting stall, Ascot’s straight five furlongs to one mile keeps horses in their lanes for longer. There is no bend to neutralise a wide draw. A horse breaking from stall 14 in a big-field sprint stays wide for the entire race unless the jockey burns energy angling across, and that energy costs finishing speed on the uphill run to the line. The stands-side rail and far-side rail offer shelter from any crosswind, but more importantly, they provide a racing line that experienced jockeys know to exploit.
The second factor is the ground variation across the track. Ascot’s straight course is wide, and the going is rarely uniform from one side to the other. When the course is watered, the stands side often rides faster. When rain softens the ground, the far side can become the place to be as the well-trodden racing line near the stands rail cuts up. This is not speculation—it shows up in results. On soft ground at six furlongs, low draws have historically outperformed high draws by a significant margin. On good to firm, the advantage shifts.
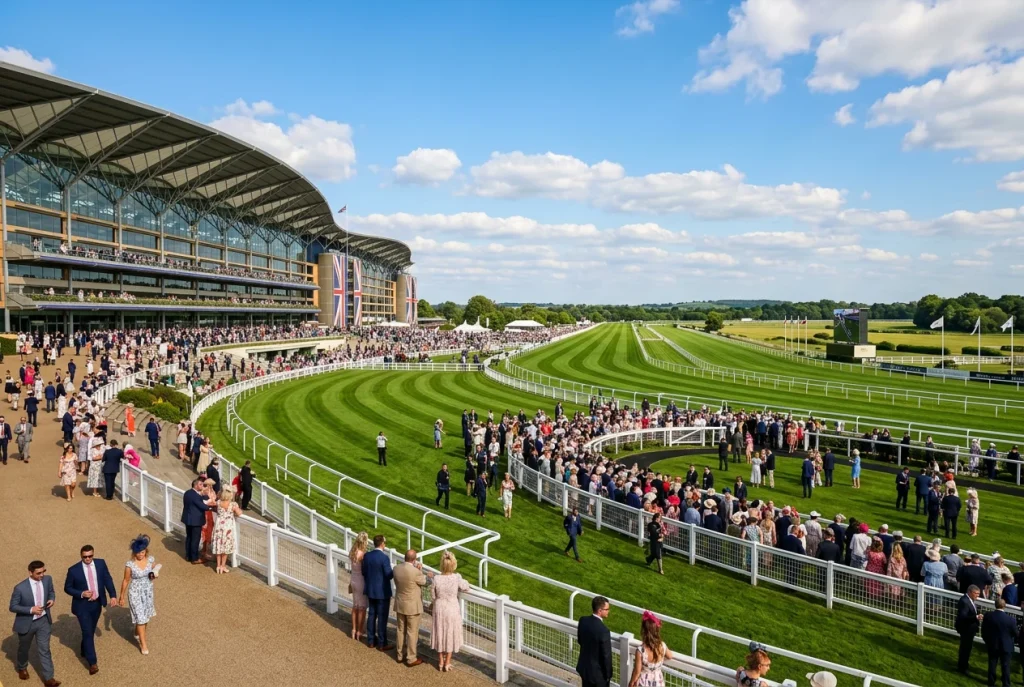
The third factor is field size. Ascot’s premier meetings, particularly Royal Ascot, regularly produce fields of 20 or more runners in handicaps. In a ten-horse race, a horse drawn 8 is not hugely disadvantaged; there is room to manoeuvre. In a 24-runner handicap down the straight course, that same stall becomes a serious problem. The horse either has to race wide with no cover or drop back to find a gap, losing ground either way. Big-field handicaps are where draw bias does its real damage to punters who ignore the numbers.
Average field sizes across British flat racing fell to 8.9 runners in 2026, down from 9.14 the previous year, according to the BHA’s Racing Report. Yet Ascot’s flagship handicaps regularly exceed that average by a factor of two. The Wokingham, the Royal Hunt Cup, the Britannia—these races routinely field 25 or more, and that volume magnifies every percentage point of draw advantage.
Five and Six Furlongs: Sprint Draw Data
The sprint distances at Ascot produce the clearest draw patterns on the entire course. Five furlongs and six furlongs are run on the straight track, with no bends to complicate the geometry. Horses break from the stalls and race in a direct line towards the winning post, which means starting position dictates racing position for the entire contest.
Data from OLBG’s Ascot statistics, compiled from race results between 2021 and 2026, reveals striking patterns. At six furlongs, stall 1 has produced a level-stakes profit of +67.33 points over this period—the most profitable position on the straight course. The worst performer is stall 7, with losses of -75.25 points over the same sample. That is a spread of more than 140 points between adjacent zones of the stalls, a disparity that would be immediately recognised and corrected by the market if it occurred in any other betting variable.
At five furlongs, the pattern is similar but compressed. The shorter distance gives less time for jockeys to recover from a poor position, which makes the initial break even more critical. Low draws—stalls 1 through 4—have historically outperformed, particularly when the ground rides fast. The far-side rail offers protection and a consistent racing line, while horses drawn in the middle of the track often end up racing in a vacuum, with no rail to follow and traffic on both sides.
The numbers become more nuanced when you split them by going. On good to firm ground, the stands-side rail tends to ride fastest, and high draws can compete. On soft or heavy ground, moisture gathers towards the stands side where the drainage is less efficient, and the far rail becomes the place to be. Trainers who understand this will deliberately aim for specific stall positions based on the forecast, but many punters back horses without checking where they have drawn.
Sprint handicaps at Royal Ascot—the King’s Stand, the Queen Mary, the Wokingham—attract fields of 20 or more almost every year. In these races, a low draw is not merely an advantage; it is frequently the difference between winning and finishing mid-pack. The pattern is robust enough that you should treat any short-priced favourite drawn in double figures with serious scepticism unless the ground is riding unusually fast on the stands side.
Seven Furlongs and the Straight Mile
The straight mile at Ascot is one of British racing’s iconic tests. The course runs downhill from the start, flattens through the middle, and then rises steeply in the final two furlongs. It is a stamina-sapping finish that exposes horses who have been too keen early, and it creates opportunities for patient riders to pick up the pieces. But the draw still matters, even over this longer trip. Field sizes at Flat Premier fixtures averaged 10.95 runners in 2026—up from 10.62 the previous year—according to the BHA’s Racing Report, and Royal Ascot handicaps frequently exceed that figure by a factor of two or more.
At seven furlongs and one mile, the relationship between draw and outcome becomes more complex. The extra distance gives jockeys time to cross the track and find a position, which dilutes the raw numerical advantage of a low stall. But the patterns do not disappear—they become conditional on pace and going.
When the early pace is strong, horses drawn low benefit from getting cover on the rail while those drawn wide burn energy in the first two furlongs trying to secure a position. When the pace is slow, the field often bunches towards the far rail, and wide-drawn horses can coast along the outside without losing ground. Reading the likely pace scenario becomes essential over these distances.
Field size at Ascot’s premier flat fixtures—the races that command the most betting interest—averaged 10.95 runners at Premier meetings in 2026, higher than the national average of 8.9. That extra volume compresses the space at the start and makes position even more valuable. The Royal Hunt Cup, run over one mile, regularly attracts fields above 20. In those conditions, draw analysis is not optional.
The going interaction persists at seven furlongs and a mile, though with less intensity than at the sprint trips. Soft ground still favours the far side, and firm ground still offers more options to horses drawn high. But the key variable shifts from draw alone to draw-plus-pace. A front-runner drawn wide in a fast-run mile can still win; a hold-up horse drawn low in a muddling pace can get boxed in. The smart approach is to layer your draw analysis onto your pace read rather than treating either in isolation.
Round Course Draws: 10f and Beyond
Once the distance extends to ten furlongs or further, races move to Ascot’s round course. The configuration is entirely different from the straight track: horses start on a chute, sweep right-handed through Swinley Bottom, climb back up towards the stands, and then join the home straight with roughly two and a half furlongs remaining. The draw still influences results, but the mechanism changes.
On the round course, low draws help because they provide the inside position into the first turn. A horse drawn 1 can slot onto the rail and save ground through Swinley Bottom, while a horse drawn 12 either has to go wide or drop back to find cover. Over a mile and a quarter or further, that lost ground adds up to several lengths by the time the field straightens for home.
Nick Smith, Director of Racing and Public Affairs at Ascot Racecourse, has emphasised that field sizes remain a priority for the course, particularly in the context of pool betting. “Field sizes are very important, especially in the World Pool era, and we hope that connections of horses that aren’t at the top of the betting might see this as a good reason to go for the big target,” he noted in a statement accompanying Ascot’s 2026 prize money announcement. Larger fields on the round course mean more potential traffic problems for horses drawn wide.
The King George VI and Queen Elizabeth Stakes—now Britain’s first £2 million race—is run over a mile and a half on the round course. Fields are smaller than in handicaps, typically 8 to 12 runners, which reduces the draw’s direct impact. But in staying handicaps and the middle-distance Group races, the bias towards low draws remains measurable. Horses breaking from stalls 1 through 5 consistently outperform those drawn 10 and above, particularly on soft ground when saving every yard of distance matters.
The short home straight at Ascot—around two and a half furlongs—compounds the problem for wide-drawn horses. Unlike Newmarket’s Rowley Mile, where a long straight allows hold-up horses to pick their way through, Ascot’s round course demands that you are in position before the final turn. A horse stuck wide at that point has almost no time to recover.
How Going Conditions Shift the Bias
Going is the variable that transforms draw bias from a static number into a dynamic edge. The patterns that hold on good ground can invert on soft, and punters who ignore the going forecast are essentially betting blind.
On Ascot’s straight course, the interaction works through drainage and watering patterns. The far side of the track—the side closest to the stalls with low numbers—tends to hold moisture longer. When the course has been watered or rain has fallen, that strip of ground rides softer than the stands side, which drains more efficiently. Horses want to race on the faster ground, which on a soft day means migrating towards the far rail. Low draws get there first.
When the ground is good to firm, the equation flips. The stands side, having dried out quickly, offers the fastest surface. High-drawn horses can race on the near rail without losing ground, and the far side becomes less attractive. In extreme cases—firm ground after a dry spell—you see the entire field switch to the stands side regardless of draw, but this is rare at Ascot, where the groundstaff water proactively to maintain safe conditions.
The round course shows the same dynamic in a different form. Soft ground exaggerates the inside rail advantage because every yard saved matters more when the surface is demanding. A horse that saves ground through Swinley Bottom on soft ground might travel two or three lengths less than a rival racing wide, and that energy conservation shows up in the finishing speed. On faster ground, wider trips are more forgivable—the surface is easier to travel on, and the lost distance is less punishing.
Average field sizes in British jump racing—where soft and heavy ground are the norm—dropped to 7.84 in 2026, down from 8.49. The same report from the BHA showed flat racing at 8.9. Ascot’s marquee handicaps exceed both averages, which means the going-draw interaction operates at maximum intensity precisely when the most money is at stake.
Draw in Big-Field Handicaps: Royal Ascot Data
Royal Ascot’s heritage handicaps are the acid test for draw theory. The Wokingham, the Royal Hunt Cup, the Britannia—these are the races that attract maximum fields, maximum betting interest, and maximum draw controversy. The data from these contests supports a clear conclusion: in fields of 20 or more on the straight course, draw is not one factor among many. It is the factor.
Analysis of Royal Ascot results shows that course form correlates strongly with success. In 2018, according to data from myracing, 11 of 30 winners had previously won or placed at Ascot. Strip out the two-year-old races—where horses have no prior course experience—and the percentage climbs higher. Course specialists thrive at Ascot partly because they handle the track, but also because their trainers know which stall positions to target.
The Wokingham, run over six furlongs on the final Saturday of Royal Ascot, provides the clearest example. Fields regularly hit 25 or more, splitting into two distinct groups: one racing far side, one racing stands side. The bias depends entirely on the going. In a typical year with good ground, the two groups have comparable strike rates. On soft ground, the far-side group dominates. Punters who back the likely pace angles without checking which rail group their selection will join are making a fundamental error.
The Royal Hunt Cup, over one mile, is slightly more forgiving because the longer distance allows some repositioning. But the principle holds: low draws have an edge, particularly when the ground is soft enough to make ground loss costly. The Britannia—a race for three-year-olds only, often with no prior Ascot form—is harder to analyse through historical patterns, but field size still matters. Horses drawn in stalls 15 and above have a statistically worse record than those drawn in single figures.
The practical application is straightforward. In any Royal Ascot handicap with 20 or more runners on the straight course, apply a filter based on draw. Do not eliminate horses drawn high outright—the going might favour them—but require a reason to back them beyond form alone. If you cannot articulate why a high-drawn horse will overcome the positional disadvantage, the bet is not worth making.
Small Fields vs Large: When Draw Stops Mattering
The relationship between field size and draw significance is not linear. In a five-runner Group 1, the draw barely registers—horses have room to manoeuvre, and class differences overwhelm positional edges. In a 25-runner handicap, draw becomes critical. Somewhere in between lies a threshold where the draw shifts from irrelevant to important.
Practical observation suggests the threshold sits around 12 to 14 runners. Below that, the track is wide enough for jockeys to find positions without significant interference. A horse drawn 10 in a 12-runner race can angle across within the first furlong and lose perhaps a length. Above 14 runners, the compression at the start makes repositioning costly. A horse drawn 10 in a 20-runner race either has to burn early speed crossing over or accept racing wide for the entire trip.
Ascot’s Group 1 races—the King George, the Queen Elizabeth II Stakes, the Champion Stakes—typically attract fields of 6 to 12. Draw analysis in these contests yields little consistent pattern. The Champion Stakes on British Champions Day, for example, has been won from a variety of stall positions over the past decade, with no clear bias emerging. The quality of the horses matters far more than where they start.
Handicaps are a different matter. The Buckingham Palace Stakes, the Wolferton, the Duke of Edinburgh—these races fall between the extremes, with fields of 12 to 18. Here, the draw is relevant but not determinative. A low draw provides a small edge rather than a transformative one, and form analysis should carry more weight than stall position. The error punters make is treating all Ascot races identically. The 6-runner Group 1 and the 24-runner handicap require entirely different analytical frameworks.
When assessing whether draw matters for a specific race, start with the declared field size. Under 10 runners: draw is a tiebreaker at most. 10 to 14 runners: draw is worth noting but not emphasising. 15 runners and above: draw becomes a primary filter. This simple heuristic will prevent you from overthinking small-field contests and underthinking the big-field cavalry charges.
Applying Draw Data to Your Next Ascot Bet
Theory is useful; application is what makes money. Here is a practical checklist for incorporating draw analysis into your Ascot betting.
First, identify the course. Is the race on the straight track or the round course? The straight course—5f to 1m—produces the strongest draw patterns. The round course—10f and beyond—still shows a low-draw bias, but it is less pronounced because the first turn allows some repositioning.
Second, check the field size. Count the declared runners. If the field is 15 or more, draw becomes a critical variable. If the field is under 10, note the draw but do not let it drive your selection. Handicaps at Royal Ascot almost always exceed the threshold; midweek maidens often fall below it.
Third, read the going. Check the morning reports on race day—Ascot provides updates through their website—and note whether the ground is described as soft, good, or good to firm. On soft ground, favour low draws on the straight course. On good to firm ground, be more open to horses drawn towards the stands side. If the going is genuinely variable—different descriptions for different parts of the track—expect the field to split into groups.
Fourth, overlay the draw onto your form analysis. Do not abandon form entirely in favour of draw; that would be overcorrecting. Instead, use draw as a filter. If two horses appear equally matched on form, give preference to the one with the better draw. If a horse looks clearly superior on form but has a poor draw, ask whether the quality gap is large enough to overcome the positional disadvantage. In handicaps, it often is not.
Fifth, track where the pace is likely to come from. Early pace often develops on the far side in sprint handicaps, which means low draws get natural cover while high draws have to push forward to avoid being stranded. If the likely pace-setters are drawn high, the dynamics shift—they will drag traffic to the stands rail, potentially leaving the far side empty. Flexibility is essential.
The payoff from this process is incremental rather than transformative. You will not suddenly find 20/1 winners by checking the draw. But you will avoid backing horses that have almost no chance of overcoming a positional deficit, and you will correctly downgrade favourites whose price does not account for a poor stall. Over a season of Ascot meetings, those edges compound.
Draw Myths at Ascot: What the Numbers Disprove
Draw bias generates strong opinions, and not all of them survive contact with the data. Several persistent myths circulate among punters and even some professionals. Here are the ones the numbers contradict.
The first myth is that draw bias is random from meeting to meeting. It is not. The structural factors—track width, drainage patterns, rail positions—are consistent. What varies is the going, which shifts the bias in predictable ways. Punters who dismiss draw analysis because “it changes every day” are conflating variation with randomness. The variation follows a pattern.
The second myth is that jockeys can overcome any draw disadvantage if they are good enough. This overestimates what jockeys can achieve. A talented jockey on a horse drawn 20 in a 24-runner sprint can perhaps minimise the damage by finding a gap early, but they cannot conjure ground that does not exist. The horse still has to travel further or expend energy to cross, and that deficit shows up in the finishing position. Great jockeys improve margins; they do not eliminate them.
The third myth is that front-runners always overcome poor draws by simply going forward. This depends entirely on where the pace develops. If multiple front-runners are drawn low, a horse drawn high has to work even harder to lead, burning energy in the process. If the pace is on the stands side and the horse is drawn far side, going forward means racing in isolation—an invitation for closers to pick them off late. Running style matters, but it does not override geometry.
The fourth myth is that certain trainers can “beat the draw” consistently. Some trainers do place horses intelligently based on stall positions, and their record at Ascot reflects that preparation. But no trainer has a magic solution for a poor draw in a big-field handicap. What good trainers do is target specific races where their horse’s draw is favourable, or withdraw when the draw is disastrous. The results look like they are beating the draw; in reality, they are avoiding unfavourable situations.
The data exists. The patterns are measurable. The market does not fully price them in, particularly in handicaps. Draw bias at Ascot is one of the clearest, most exploitable edges available to punters who are willing to do the work. The only question is whether you will use it.